
Ecommerce Speed Is a Sales Metric, Not Just a Technical Metric
Ecommerce website speed optimization is often filed under “technical work,” something for developers to worry about after the store looks nice and the products are uploaded. That framing quietly costs online stores money every day. In reality, how fast your store loads touches every step of the shopping journey: the landing page a shopper arrives on, the category page where they browse, the product page where they decide, the cart where they commit, and the checkout where they pay. A delay at any of those points is a delay in someone’s decision to buy.
Speed shapes trust and confidence long before a customer consciously thinks about it. When a page appears instantly and responds the moment they tap, people feel they are dealing with a capable, professional business. When pages stall, images pop in late, or buttons ignore the first tap, visitors quietly conclude the store is unreliable — and an unreliable store is not one they want to hand their card details to.
It helps to separate two ideas that are easy to confuse. Technical availability means your server is up and the page will eventually load. Perceived performance means how fast the experience actually feels to a real person on a real phone. A store can be “available” and still feel painfully slow. Ecommerce website speed optimization is the practice of closing that gap — making stores load, render, and respond quickly enough that shoppers stay, browse, and buy.
The urgency is not theoretical. Google’s research found that 53% of mobile visits are likely to be abandoned when a page takes longer than three seconds to load. Over the rest of this guide, we’ll look at what the conversion data actually shows and how Google’s Core Web Vitals connect directly to sales.
| Finding | What the source reported |
|---|---|
| 53% mobile abandonment | Google reports 53% of mobile visits are likely abandoned when a page takes over 3 seconds to load. |
| 3.05% vs 0.67% | Portent found an average 3.05% conversion at a 1-second load, dropping to 0.67% at 4 seconds. |
| 2.5× conversions | Portent found stores loading in 1 second converted about 2.5 times better than those loading in 5 seconds. |
| 0.1-second gain | Google and Deloitte linked a 0.1s mobile speed gain to 8.4% more retail conversions and 9.2% higher average order value. |
| 8% more sales | Vodafone’s A/B test found a 31% LCP improvement produced 8% more sales and an 11% better cart-to-visit rate. |
| 33.13% conversion lift | Rakuten 24 reported a 33.13% conversion lift, 53.37% more revenue per visitor, and a 35.12% lower exit rate. |
How Many Customers Leave Because a Store Is Slow?
The honest answer is: more than most store owners realize, and most of them leave silently. Google’s benchmark of three seconds on mobile is the moment where roughly half of visits are at risk. Mobile shoppers are especially impatient because they’re often browsing on the move, on congested Wi-Fi or a variable 4G signal, with less tolerance for a spinning loader than someone sitting at a desk.
It helps to know exactly what you’re losing, because three different metrics describe three different escapes. Bounce rate captures visitors who land on one page and leave without interacting. Exit rate captures the page people were on when they left after viewing several. Cart abandonment captures shoppers who added products but never completed checkout. Slow performance feeds all three. A sluggish category or product page interrupts comparison shopping at the exact moment a customer is weighing your item against a competitor’s — and if the page hasn’t rendered, there’s nothing to weigh.
The most expensive losses are the invisible ones. A visitor who leaves before a product page even appears never becomes a shopper, never adds to cart, and never shows up in your abandonment reports as a near-miss. They simply vanish. This is where the hidden cost of acquisition bites hardest: if you’re paying for ads, every click that lands on a slow page is money spent to send someone to a door that opens too slowly.
Here’s a simple illustration — not an industry benchmark, just a way to picture the scale. Imagine a store with 20,000 visits a month. If even 10% of those people give up before they reach a product page, that’s 2,000 shopping opportunities lost every month before selling has a chance to happen. Multiply that by your average order value and the ad spend behind those clicks, and “just a technical issue” starts to look like a serious commercial leak.

Page Load Time and Conversion Rate: What the Data Shows
When you move from abandonment to actual conversions, the pattern gets sharper. Portent’s ecommerce analysis found that the highest conversion rates cluster in the one-to-two-second range: an average of 3.05% at a one-second load, falling to 0.67% by four seconds. Put plainly, dragging out those first few seconds can cut your conversion rate to a fraction of what it could be. In the same research, stores loading in one second converted roughly 2.5 times better than stores loading in five seconds.
Independent experiments back this up under controlled conditions, which matters — these aren’t just correlations. Google and Deloitte’s “Milliseconds Make Millions” study, based on millions of user sessions, associated a mere 0.1-second improvement in mobile speed with an 8.4% increase in retail conversions and a 9.2% increase in average order value. A tenth of a second is a change most shoppers wouldn’t consciously notice, yet it moved real revenue.
Two published case studies isolate speed cleanly by changing nothing else. Vodafone ran an A/B test where the only meaningful difference was a 31% better Largest Contentful Paint on the optimized page; that page produced 8% more sales, an 11% improvement in cart visits, and a 15% improvement in its lead-to-visit rate. Rakuten 24 focused on passing Core Web Vitals and reported a 33.13% higher conversion rate, 53.37% more revenue per visitor, and a 35.12% reduction in exit rate.
A word of caution before you bank on these numbers: they are real, but they are not universal guarantees. Results depend on your starting point, your audience, your product, and how slow you were to begin with. Still, the direction is remarkably consistent across every study.
Here’s a compact calculation to make it concrete. Suppose a store earns $500,000 a year at a 2% conversion rate. If a faster experience lifts conversions by a conservative 10% — well below what Rakuten 24 measured — that’s roughly $50,000 in additional annual revenue from the same traffic you’re already paying to attract.

Core Web Vitals for Ecommerce: The Three Metrics That Matter
Core Web Vitals are Google’s attempt to measure page experience the way a real shopper feels it, rather than through abstract technical scores. They cover three things: how quickly the main content loads, how quickly the page responds to interaction, and how visually stable it stays while loading. Crucially, they’re based on real user experience, not simulations.
That real-world grounding comes from the Chrome User Experience Report, which collects field data from actual Chrome users visiting your pages. Google assesses your performance at the 75th percentile of those visits — meaning at least three out of four real visits need to hit the “good” threshold, segmented separately for mobile and desktop. This is why a single fast test on your own laptop can be misleading.
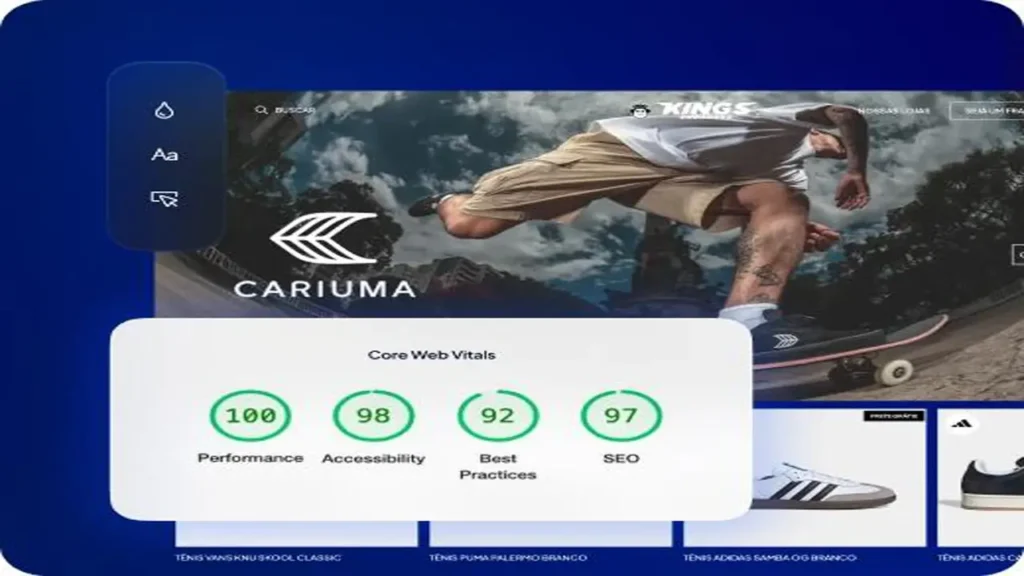
It’s worth understanding the difference between two kinds of data. Lab diagnostics — the kind you get from a Lighthouse run in PageSpeed Insights — simulate one load under fixed conditions and are excellent for debugging. Field data reflects what your actual visitors experienced on their own devices and networks. A perfect Lighthouse score of 100 is encouraging, but it does not automatically mean every visitor is having a good experience on a mid-range phone with three tracking scripts running.
One more piece of context so expectations stay realistic: page experience supports SEO, but it doesn’t replace content quality, relevance, or authority. Google treats Core Web Vitals as one input among many in its ranking systems — closer to a tiebreaker between comparable pages than a magic ranking lever. Fast pages help you compete; they don’t excuse thin or irrelevant content. Here are the thresholds a good store should aim for.
| Metric | Good result | What it means in a store |
|---|---|---|
| Largest Contentful Paint (LCP) | 2.5 seconds or less | The main product image or hero content appears quickly. |
| Interaction to Next Paint (INP) | 200 milliseconds or less | Filters, options, and add-to-cart buttons respond fast. |
| Cumulative Layout Shift (CLS) | 0.1 or less | Prices, buttons, and images don’t jump while loading. |
Largest Contentful Paint: How Quickly Shoppers See the Product
Largest Contentful Paint measures how long it takes for the biggest, most meaningful piece of content to appear on screen. On an ecommerce page, that element is usually exactly what the shopper came for: the main product image, a hero banner, the product title block, a promotional image, or a large category heading. If that element is slow, the shopper stares at a blank or half-built page during the very moment their interest is highest.
Several common problems drag LCP down. Oversized product images that are far larger than the space they fill are the classic culprit. Slow hosting with a poor Time to First Byte delays everything before rendering even starts. Render-blocking CSS holds up the first paint, unoptimized web fonts push text back, and hero sections that are drawn by JavaScript force the browser to do extra work before the image shows. Missing preload priority and a stack of carousel sliders make it worse.
The good news is that LCP responds well to a handful of focused fixes. Serve images in modern formats like WebP or AVIF, and resize each image to the dimensions it’s actually displayed at rather than shipping a huge original. Preload the genuine LCP asset so the browser fetches it early, and apply the fetchpriority=”high” hint where it helps. Improve server response time through better hosting and caching. And critically, never lazy-load the above-the-fold LCP image — lazy loading is for content further down the page. Tell the browser what matters most, and let it fetch that first.
Interaction to Next Paint: Why Buttons and Filters Feel Slow
If LCP is about how fast a store appears, Interaction to Next Paint is about how fast it responds once it’s there. INP measures the delay between a shopper’s action and the page visibly reacting. In a store, that covers a lot of high-stakes moments: add-to-cart buttons, size and colour selectors, search autocomplete, product filters, mobile menus, quantity controls, and every field in the checkout form. When these lag, the store feels broken even if nothing is technically wrong.
The causes are almost always about the browser’s main thread being overloaded. Large JavaScript bundles and long main-thread tasks block the page from reacting. Excessive third-party tracking, heavy review widgets, unoptimized variation scripts, multiple marketing pop-ups, and complex page-builder elements all pile onto that same thread, so a single tap has to wait its turn behind a queue of background work.
Fixing INP is mostly about doing less, and doing it later. Defer non-critical JavaScript so it doesn’t compete with the shopper’s first interactions. Break long tasks into smaller units that let the browser respond between them. Remove unused scripts and plugins entirely rather than just hiding them. Load third-party widgets only when they’re actually needed — a reviews widget can wait until someone scrolls to reviews. Simplify event handlers, and test real interactions like tapping a filter or adding to cart, not just the initial page load. A store that renders fast but freezes on the first tap still loses the sale.
Cumulative Layout Shift: Preventing Misclicks and Lost Trust
Cumulative Layout Shift measures how much the page moves around unexpectedly while it loads. This is the metric behind that maddening experience where you go to tap a button, something loads above it, the whole layout jumps, and you tap the wrong thing. During shopping and checkout, that’s not just annoying — it erodes trust and causes real misclicks, like accidentally adding the wrong variant or, worse, confirming something during payment.
The usual causes are elements that arrive without a reserved space. Product images without fixed width and height dimensions let the page reflow when they load. Late-loading banners, cookie notices that push content downward, dynamically inserted reviews, web-font swaps, promotional bars, delayed stock and delivery messages, and sticky headers that change size all shove the interface around after the shopper has already started reading.
The remedies are refreshingly concrete. Always define image width and height so the browser reserves the right space in advance. Reserve space for banners and widgets before they load. Use stable font-loading strategies to avoid text jumping as fonts swap in. Overlay cookie notices on top of the page instead of pushing critical content down. Avoid inserting new elements above existing content once the page has started rendering. And test your cart and checkout layouts specifically on mobile, where a small shift at the wrong moment can send a payment tap to the wrong button. Stable pages feel trustworthy, and trust is what turns a browser into a buyer.

AI and Web Development
Cutting-edge web development powered by artificial intelligence. Smart automation, AI-driven content, chatbots, and intelligent features to enhance user experience and boost conversion rates.
- • AI-Powered Automation
- • Smart Chatbots & Assistants
- • AI Content Generation
- • Data-Driven Optimization
Mobile Ecommerce Performance and the Real Customer Experience
Testing only on desktop creates a comforting illusion. Your store loads instantly on your fast office connection and modern laptop, so everything seems fine — while most of your customers are having a slower experience on a phone. That gap is where sales quietly disappear, because mobile ecommerce performance is defined by conditions that desktop testing never sees.
Real shoppers use mid-range smartphones far more than flagship devices, and those phones have slower processors that struggle with heavy JavaScript. They’re on 4G, congested Wi-Fi, or patchy signal rather than fibre. They deal with product images that must be responsive across screen sizes, mobile-first navigation, touch targets that need to respond instantly, and the compounding weight of tracking scripts. Add checkout friction and the physical distance between the shopper and your hosting server, and a store that felt fast on desktop can feel sluggish in the hand.
The fix starts with testing the right pages under the right conditions. Don’t just check the home page — test the full journey: the category page, the product page, site search, the cart, the checkout, and the logged-in customer area. Each of these can hide its own performance problem.
Use a combination of tools rather than trusting any single one. PageSpeed Insights gives you both lab diagnostics and field data. Google Search Console’s Core Web Vitals report shows how groups of real pages are performing over time. Chrome DevTools lets you throttle the connection and simulate a slower device while you debug. And real-user monitoring captures what actual visitors experience day to day. Together, they replace false confidence with an honest picture of your mobile store.
Practical Page Speed Optimization Checklist for Online Stores
Effective page speed optimization is about doing the high-leverage things first, then measuring, then refining. Here’s a priority-ordered approach you can work through.
Start with the high-impact actions, roughly in this order. Upgrade poor hosting, because a slow server undermines everything else. Configure full-page and object caching so repeat requests are served instantly. Use a content delivery network to serve assets closer to your shoppers. Optimize the database, especially on larger stores where slow queries drag out response times.
Convert and resize images to modern formats at their displayed dimensions. Remove unused plugins and applications rather than leaving them dormant. Reduce third-party JavaScript, since tracking and marketing scripts are common bottlenecks. Minify and defer non-critical assets, preload critical resources, and optimize fonts. Then reduce DOM complexity, replace heavy sliders and animations, and monitor checkout scripts separately — checkout is where lost speed costs the most.
Just as important is a disciplined measurement workflow. Record your baseline Core Web Vitals before you change anything, so you can prove improvement later. Identify your high-traffic templates and prioritize product, category, cart, and checkout pages over rarely-visited ones. Change one major performance component at a time so you know what actually helped. Compare both field data and business metrics like conversion and revenue, not just lab scores. Finally, prevent regression with monthly monitoring, because new plugins, campaigns, and content can quietly undo your gains.
| Quick wins | Developer-level improvements |
|---|---|
| Compress and convert images to WebP/AVIF | Move rendering logic from client-side to server-side |
| Enable caching and add a CDN | Split large JavaScript bundles and break up long tasks |
| Remove unused plugins and pop-ups | Preload the LCP asset and set fetch priorities |
| Set image width and height to stop layout shift | Optimize database queries and server response time |
| Delay non-critical third-party widgets | Refactor variation scripts and page-builder elements |
Turning Website Speed Into Conversion Growth
Step back and the commercial argument is simple. Faster pages retain more of the paid and organic traffic you already work hard to earn, so you get more value from every ad click and every search visit. Better responsiveness reduces friction at exactly the moments shoppers decide to buy — tapping a filter, choosing a size, hitting checkout. Stable layouts prevent misclicks and build the quiet confidence that makes people comfortable entering payment details. And improved performance reinforces itself across the board, supporting SEO, advertising efficiency, conversion rate, and overall customer experience at the same time.
The most useful shift in mindset is to stop treating this as a one-time technical project and start treating Core Web Vitals as an ongoing business KPI, watched as closely as conversion rate or average order value. Stores change constantly — new products, new campaigns, new scripts — and speed erodes if no one is watching. A four-second page may technically work, but commercially it can already be too late: shoppers don’t file a complaint, they just buy from a faster competitor.
Is your online store losing customers before its products even appear? Andreev Web Studio builds and optimizes fast, conversion-focused ecommerce websites with stronger mobile performance and better Core Web Vitals. If you want a faster store that turns more of your existing traffic into sales, Andreev Web Studio can carry out a professional website performance review and put effective ecommerce website speed optimization to work for your business.

UX/UI Design
User-centered design services for intuitive and engaging digital experiences. Wireframing, prototyping, visual design, and usability testing to create websites that convert visitors into customers.
- • User Research & Personas
- • Wireframes & Prototypes
- • Visual & Interface Design
- • Usability Testing
Frequently Asked Questions
How does website speed affect ecommerce sales?
Speed affects sales at every stage of the journey. Google found that 53% of mobile visits are likely abandoned beyond three seconds, and Portent measured conversion rates falling from 3.05% at one second to 0.67% at four seconds. Faster stores keep more visitors and convert more of them.
What is a good loading time for an online store?
Aim to show your main content within 2.5 seconds, which is Google’s “good” threshold for Largest Contentful Paint, measured at the 75th percentile of real visits. The strongest-performing ecommerce pages in Portent’s data loaded in one to two seconds.
Which Core Web Vital is most important for ecommerce websites?
All three matter, but LCP is often the first priority because it determines how quickly shoppers see the product. Vodafone’s 31% LCP improvement produced 8% more sales. INP and CLS then protect the interaction and stability that carry shoppers through to checkout.
Does Core Web Vitals performance affect Google rankings?
Yes, but modestly. Google uses Core Web Vitals as part of its ranking systems while stressing that good scores don’t guarantee good positions. They behave more like a tiebreaker between comparable pages, so relevance and content quality still come first.
Why is my ecommerce website slow on mobile?
Common reasons include oversized images, heavy JavaScript and tracking scripts, too many third-party widgets, poor hosting, and testing only on fast desktop connections. Mid-range phones and variable mobile networks expose problems that desktop testing hides.
How can I improve the speed of a WooCommerce or Shopify store?
Start with high-impact fixes: better hosting and caching, a CDN, images converted to WebP or AVIF at display size, fewer plugins and third-party scripts, and deferred non-critical JavaScript. Reserve space for images and banners to keep layouts stable, and monitor checkout scripts separately.
How often should an online store be tested for Core Web Vitals?
Treat it as ongoing rather than one-off. Record a baseline, then monitor at least monthly and after any major change — a new theme, plugin, campaign, or tracking script — since these can silently undo earlier improvements.

BestChina3DPrinters.com
Your trusted guide to Chinese 3D printers. Expert reviews, comparisons, and recommendations for FDM and resin printers from top brands like Creality, Anycubic, Flashforge, and more.
- • Expert Reviews & Guides
- • Price Comparisons
- • Discount Codes & Deals
- • Beginner-Friendly Tips